The Yamaha DX7 Envelope Generator, part three.
Part two is here
Extracting the envelope.
We concluded part two finding out that the DX7 envelope generator’s curves were:
- non linear, apparently exponential.
- rising faster than they were decreasing.
Let’s try to find out if the curves are indeed exponential.
Before we proceed, let’s modify our tool to plot only what really
interests us: the envelope.
This
patch
to raw2plot.c adds a crude envelope detector: it tracks the delta
between two samples to detect a local maximum when the derivative of
the signal changes sign from positive to negative.
The output will now contain two columns: the first one is the signal, the second is the envelope.
$ ./raw2plot < envtest0.raw > envtest0.plt
$ gnuplot
gnuplot> plot ’envtest0.plt’ using [1:3] with
lines
Now that we have the envelope extracted, we can finally try to understand more about it without being distracted by the wave’s oscillations.

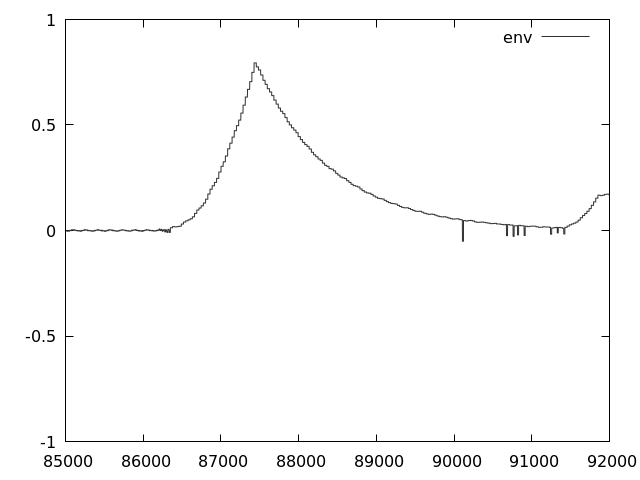
Our recording and the first two segments of our signal after being processed by the envelope detector.
Normalising the envelope
The record we’re using has maximum volume at 0.794. In order to make our calculations more generic, let’s normalise this by setting the maximum to 1.0.
[This patch] adds support for an passing an optional normalisation
factor to raw2plot.
This command:
$ ./raw2plot .794 < envtest0.raw > envtest0.plt
will produce the same graph as above, scaled so that value 0.794 will become 1.0.
For the rest of this article we’ll be using the normalised envelope.
Searching for exponentials.
A quick and immediate way to check for exponential curves of the form
exp(x * T) in the envelope is to plot in logscale. this is easy in
gnuplot, using set logscale y.
$ gnuplot
gnuplot> set logscale y
gnuplot> plot ’envtest0.plt’ using [1:3] with
lines
This will produce a log-linear plot of the envelope: abscissa unmodified but ordinate in log10.
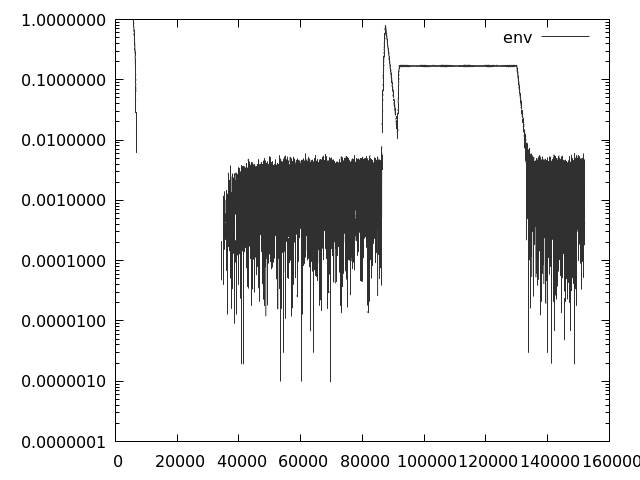
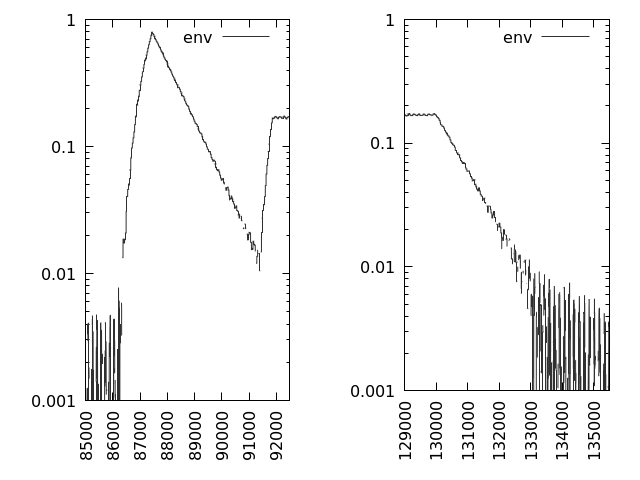
Logscale (base 10) plot of the envelope, and details about segments.
It emerges clearly that the decreasing edges are linear in log scale: this means they’re pure exponential. The increasing segments are more complicated.
Decreasing segments
We have finally collected enough data to find the equation of one element of the DX7 envelope generator: the decreasing segments.
The first segments reaches the maximum (1.0) at sample 87427, and decrease linearly until sample 91410. Near the zero the graph is polluted by recording noise, so we take another earlier sample point and find the decay constant. Let’s note that at sample 89640, output is circa .1.
The slope of the segment in the log-linear plot is:
d = -log(.1 / 1) / (89640 - 87427) = 0.00104
d is the decay constant we’re searching for, and a decreasing
envelope in DX7 at rate 50, with a sampling rate of 44100 sample/secs,
will behave as:
env(t) = V * exp(-d * t)
where V is the maximum level reached by the envelope.
The time constant for rate 50 of a decreasing envelope is:
T = 1/d = 961.1 samples
Let’s prove our theory comparing or wave with the exponential 0.8 * exp( -d * (x - 87427)):
$ gnuplot
gnuplot> plot [-1:1] ’envtest0.plt’ using 1:2
with lines, .8*exp(-.00104 * (x - 87427))
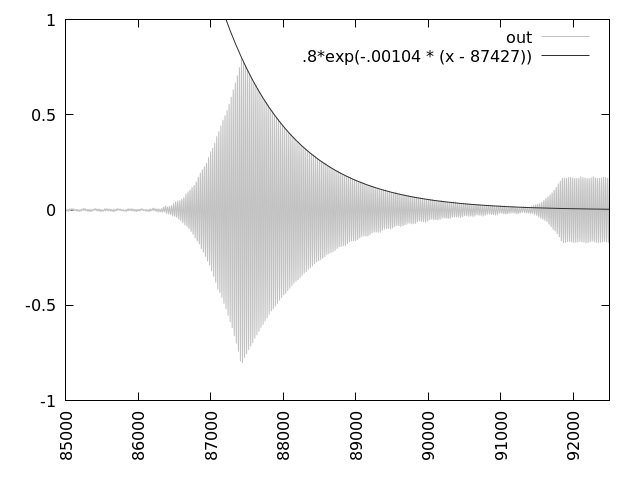
Our curve matches perfectly the decreasing envelope!
Conclusions
What we have so far is a characterization of the decreasing segment of an envelope in a DX7, with precise measurement for rate 50 (the one recorded).
In part four, we’ll focus on the rising segments.
Updated sourcecode for rawp2plot.c is in the ‘part3’ branch of
this
GitHub project
.
Part four is here